All projects

04 / 04 · Weather app

Monsoon

Where will it rain? Monsoon maps cloud cover and pressure over Singapore's towns, works out each town's chance of rain, and plays the weather forward so you can watch systems move. It began as a C++ university assignment, which I rebuilt from scratch and took much further.

  • C++17
  • Dear ImGui
  • OpenGL
  • Fuzz-tested

01 / Features

What it does

01

Weather that moves

Press play and the next 48 hours unfold. Pressure systems drift with the monsoon wind, clouds gather under lows and clear under highs, and every town's forecast updates as the weather passes. Lines of equal pressure, with H and L at the highs and lows, move with it like a forecaster's chart.
  • Weather simulation
  • Isobars
  • Marching squares

02

Singapore's three seasons

Bands of prolonged rain in the northeast monsoon, afternoon thunderstorms between the monsoons, and Sumatra squalls sweeping in from the west in the southwest monsoon. Each season starts from its own typical weather, over 29 towns at their real positions. The weather is simulated, not a live forecast.

  • 29 towns
  • Real coastline
  • Seasonal patterns
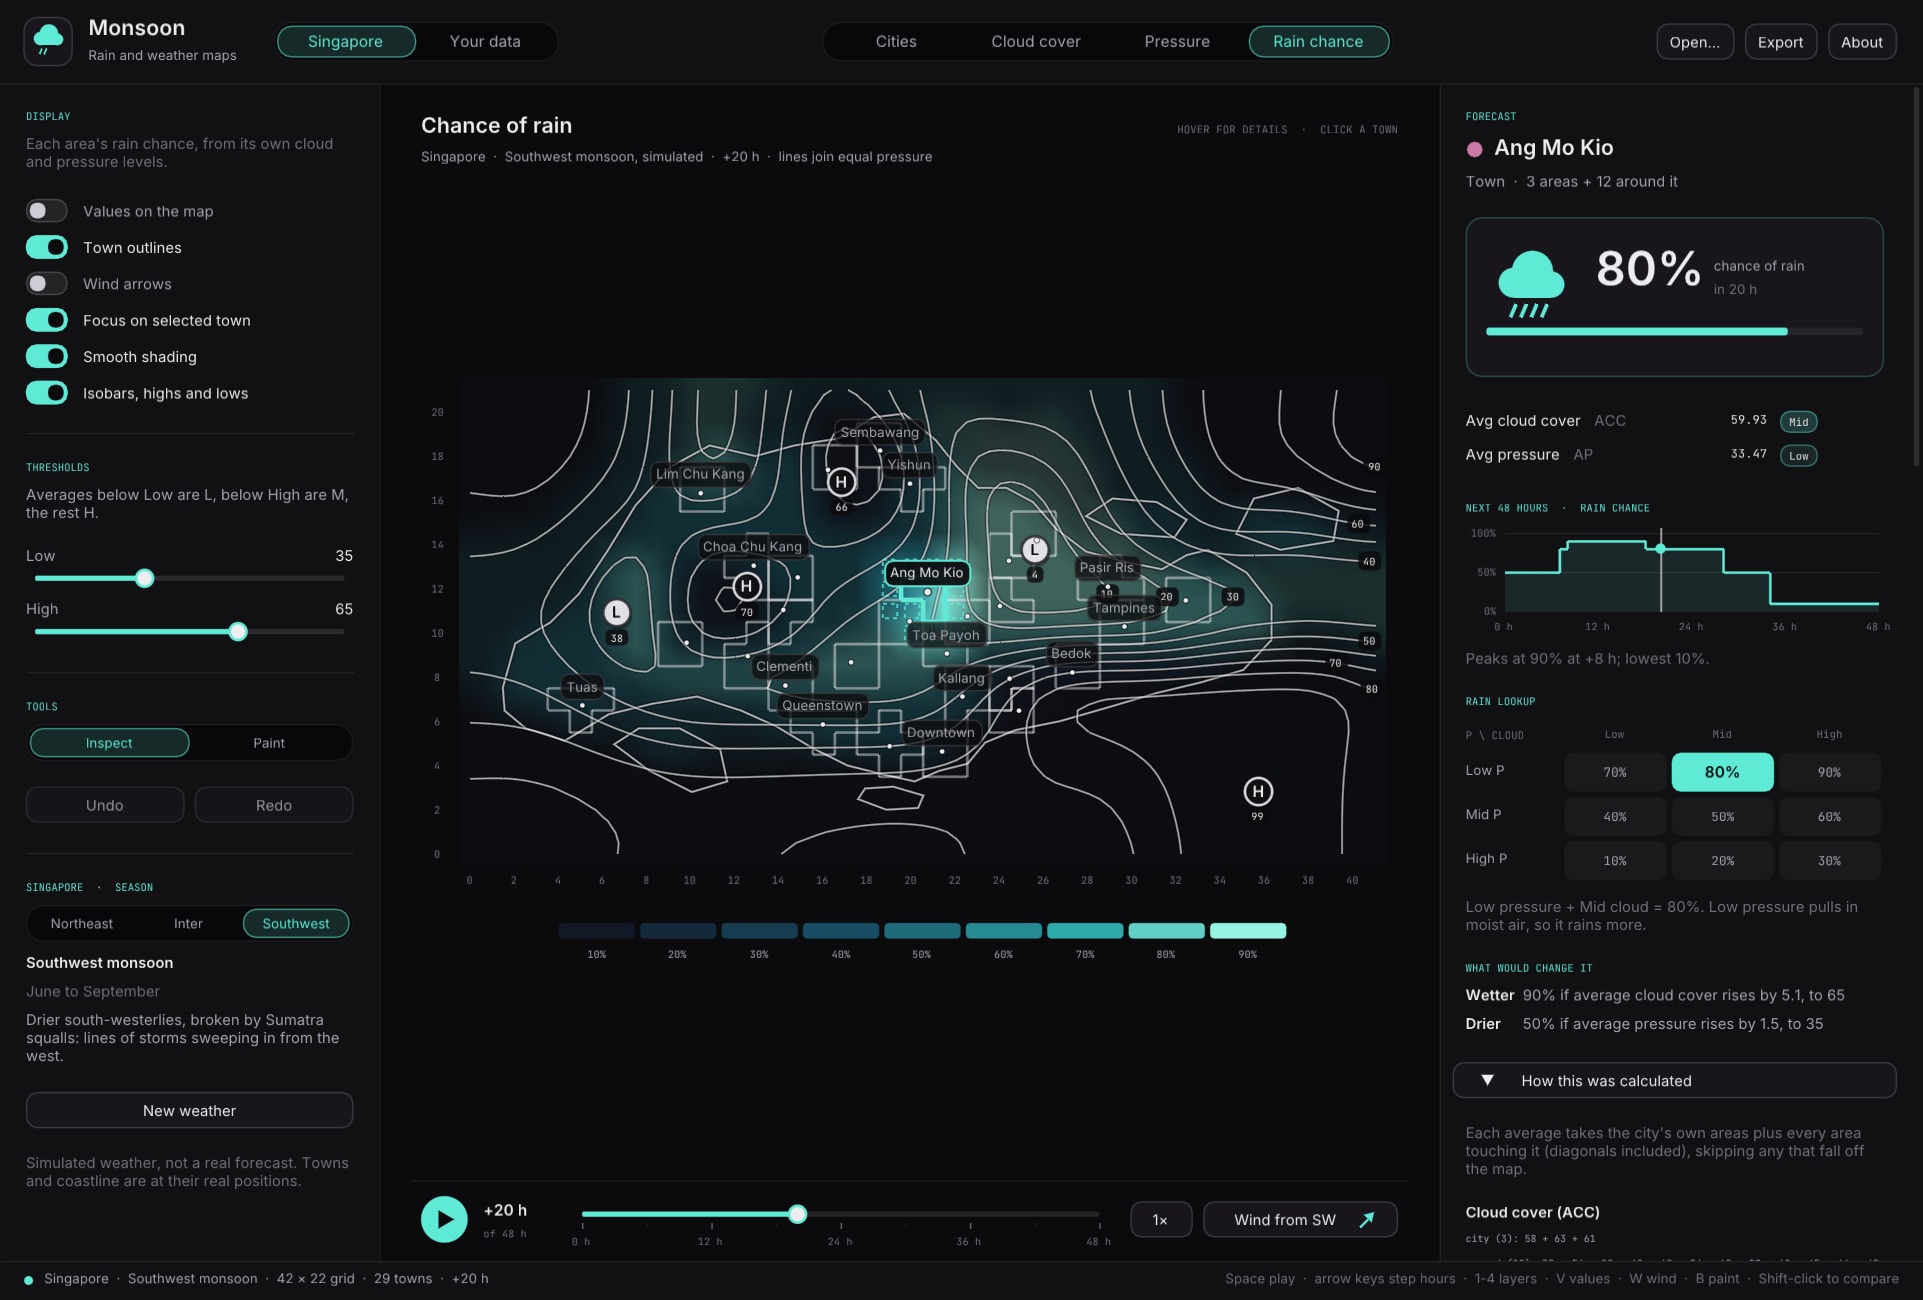
Monsoon showing Ang Mo Kio's 80% chance of rain, its 48-hour outlook and how the forecast was worked out

03

Every forecast explained

Click a town to see its chance of rain, a 48-hour outlook, the exact lookup that produced the number and the full working behind each average. It also shows what would have to change for the town to get wetter or drier.

  • Transparent maths
  • 48-hour outlook
  • What-if analysis
Monsoon's Your data tab showing a generated map and its rain chances

04

Your own data too

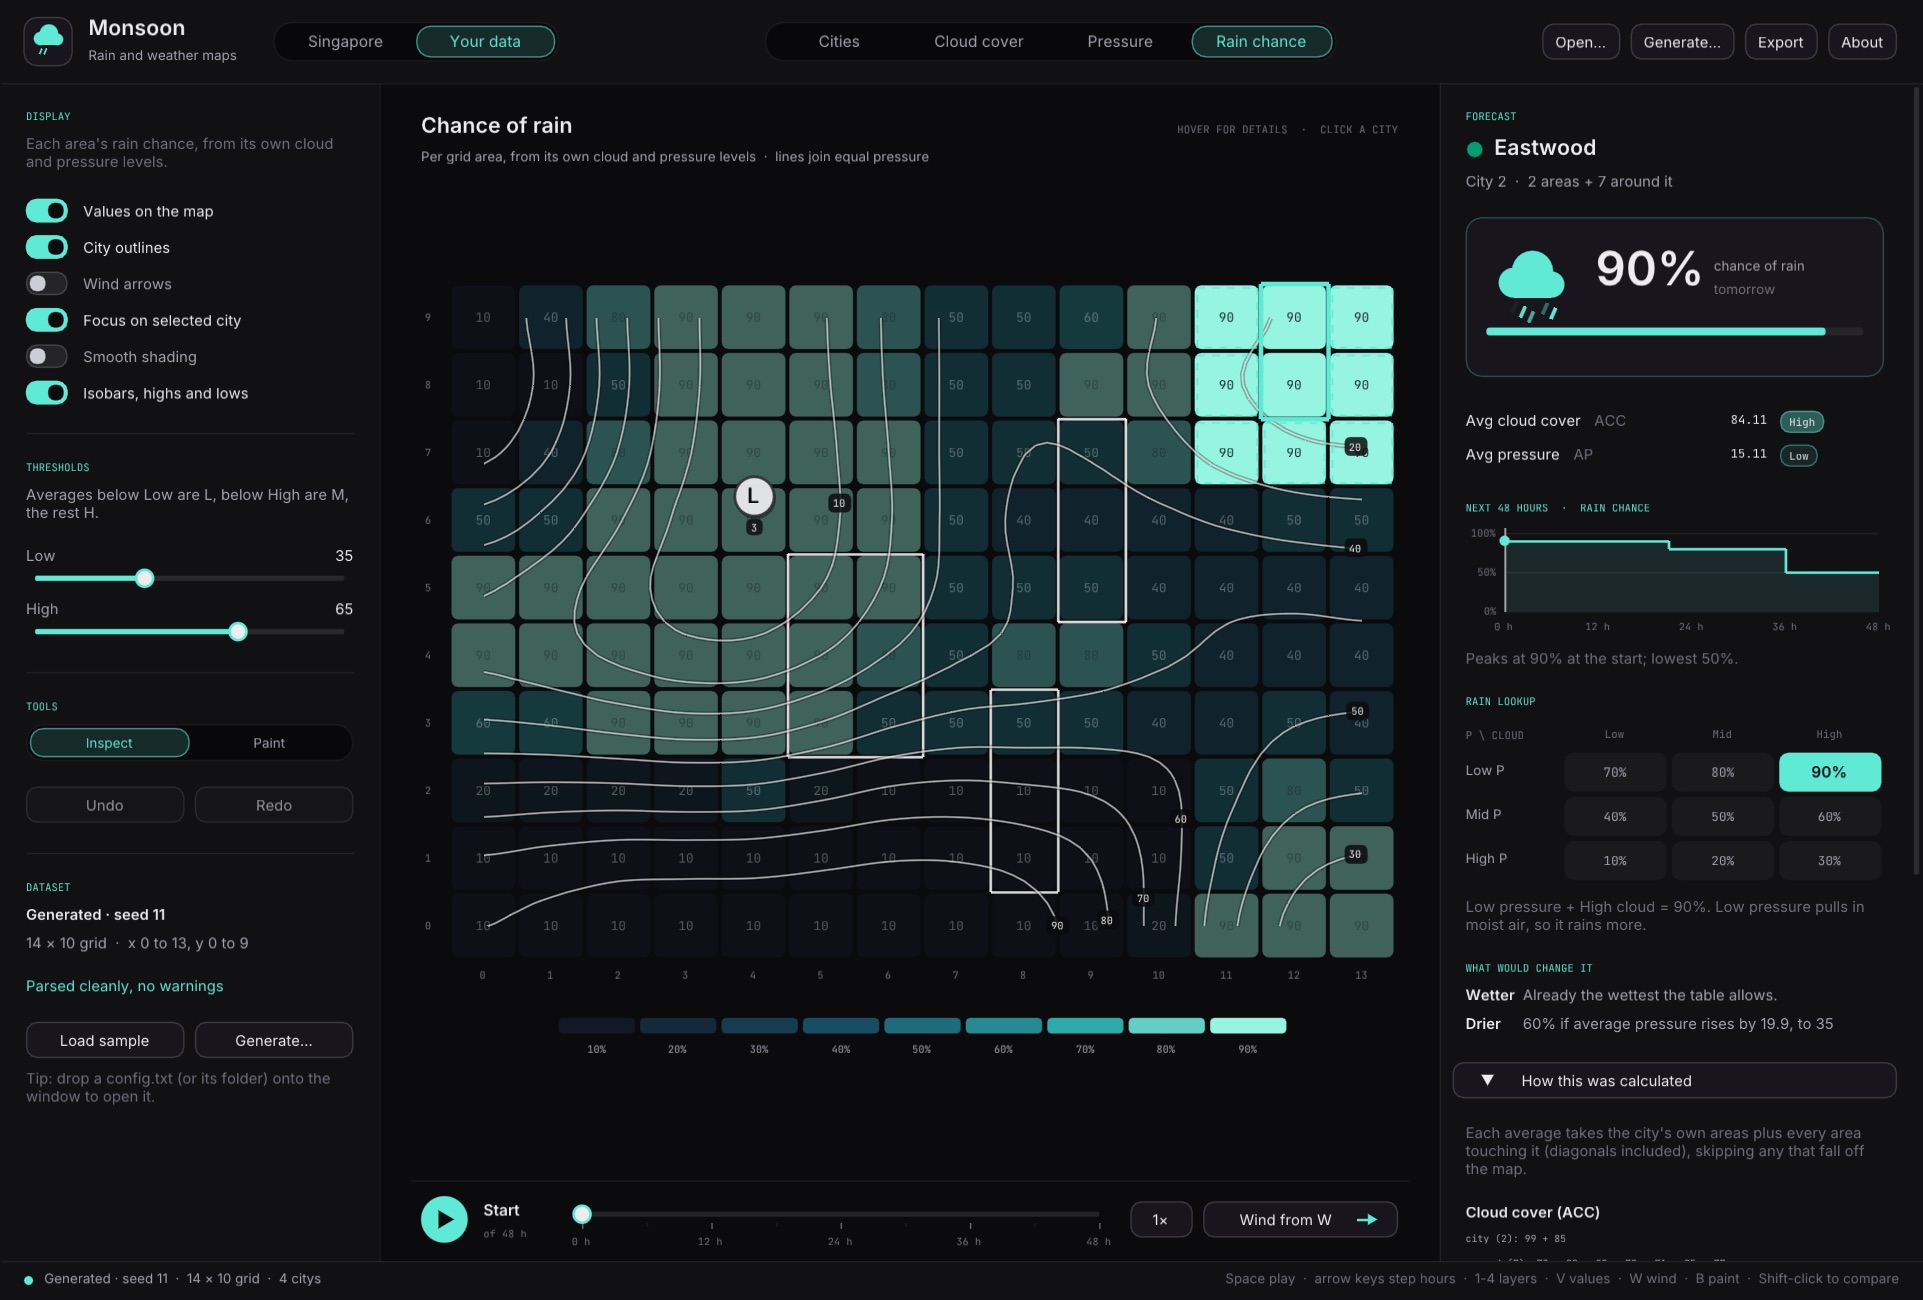
A second tab reads weather maps from plain text files, the original assignment's format, and flags bad lines instead of crashing. You can paint weather onto the map, generate random maps, and export reports, CSV tables or the playback as a video.

  • File parsing
  • Paint and undo
  • MP4 / GIF export

02 / Screens

A closer look

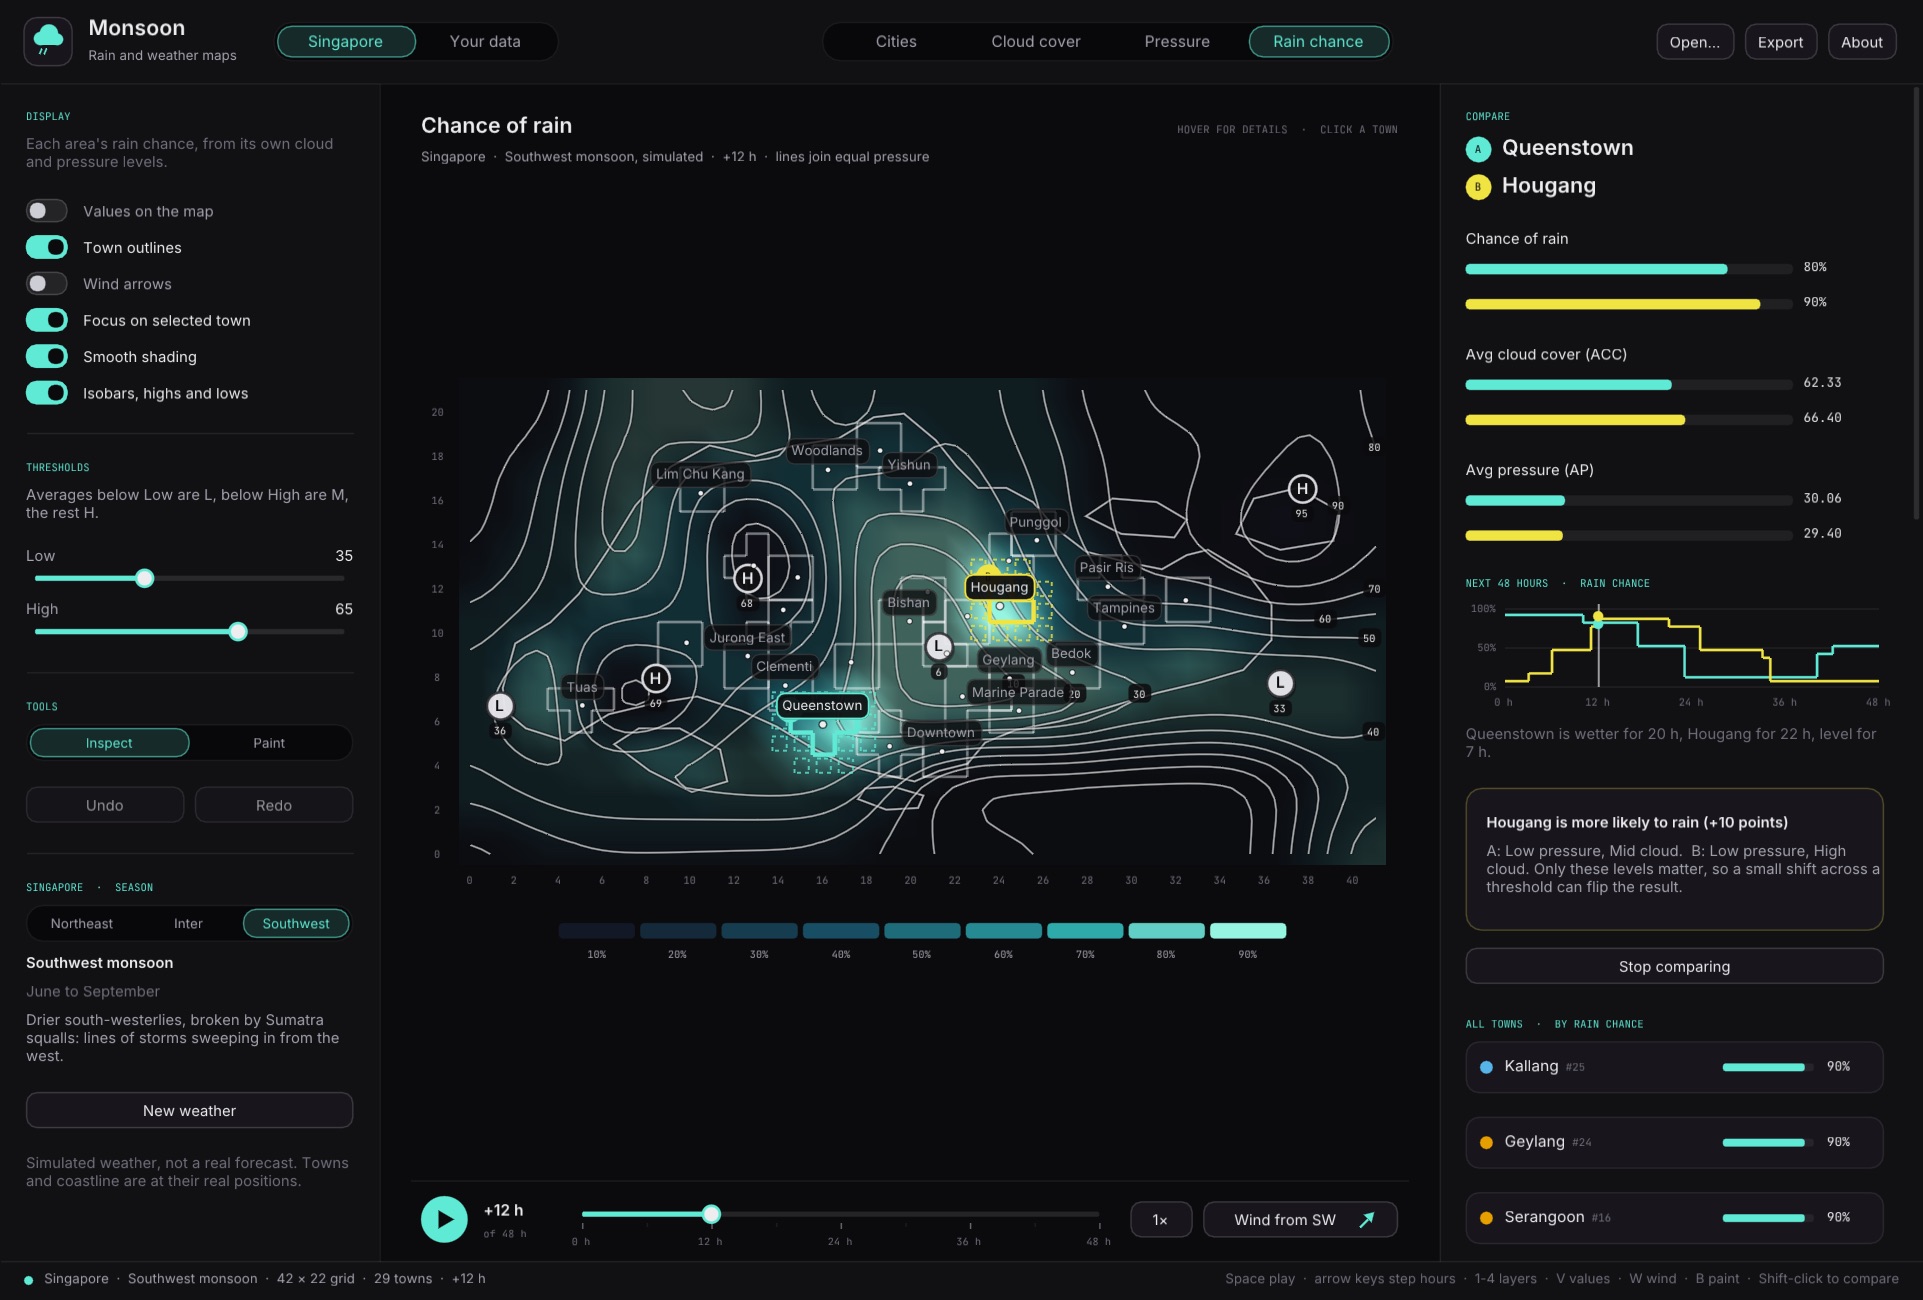
Comparing Queenstown and Hougang side by side

Compare two towns

Side-by-side bars, both 48-hour outlooks and a plain-English verdict on which town will be wetter, and why.

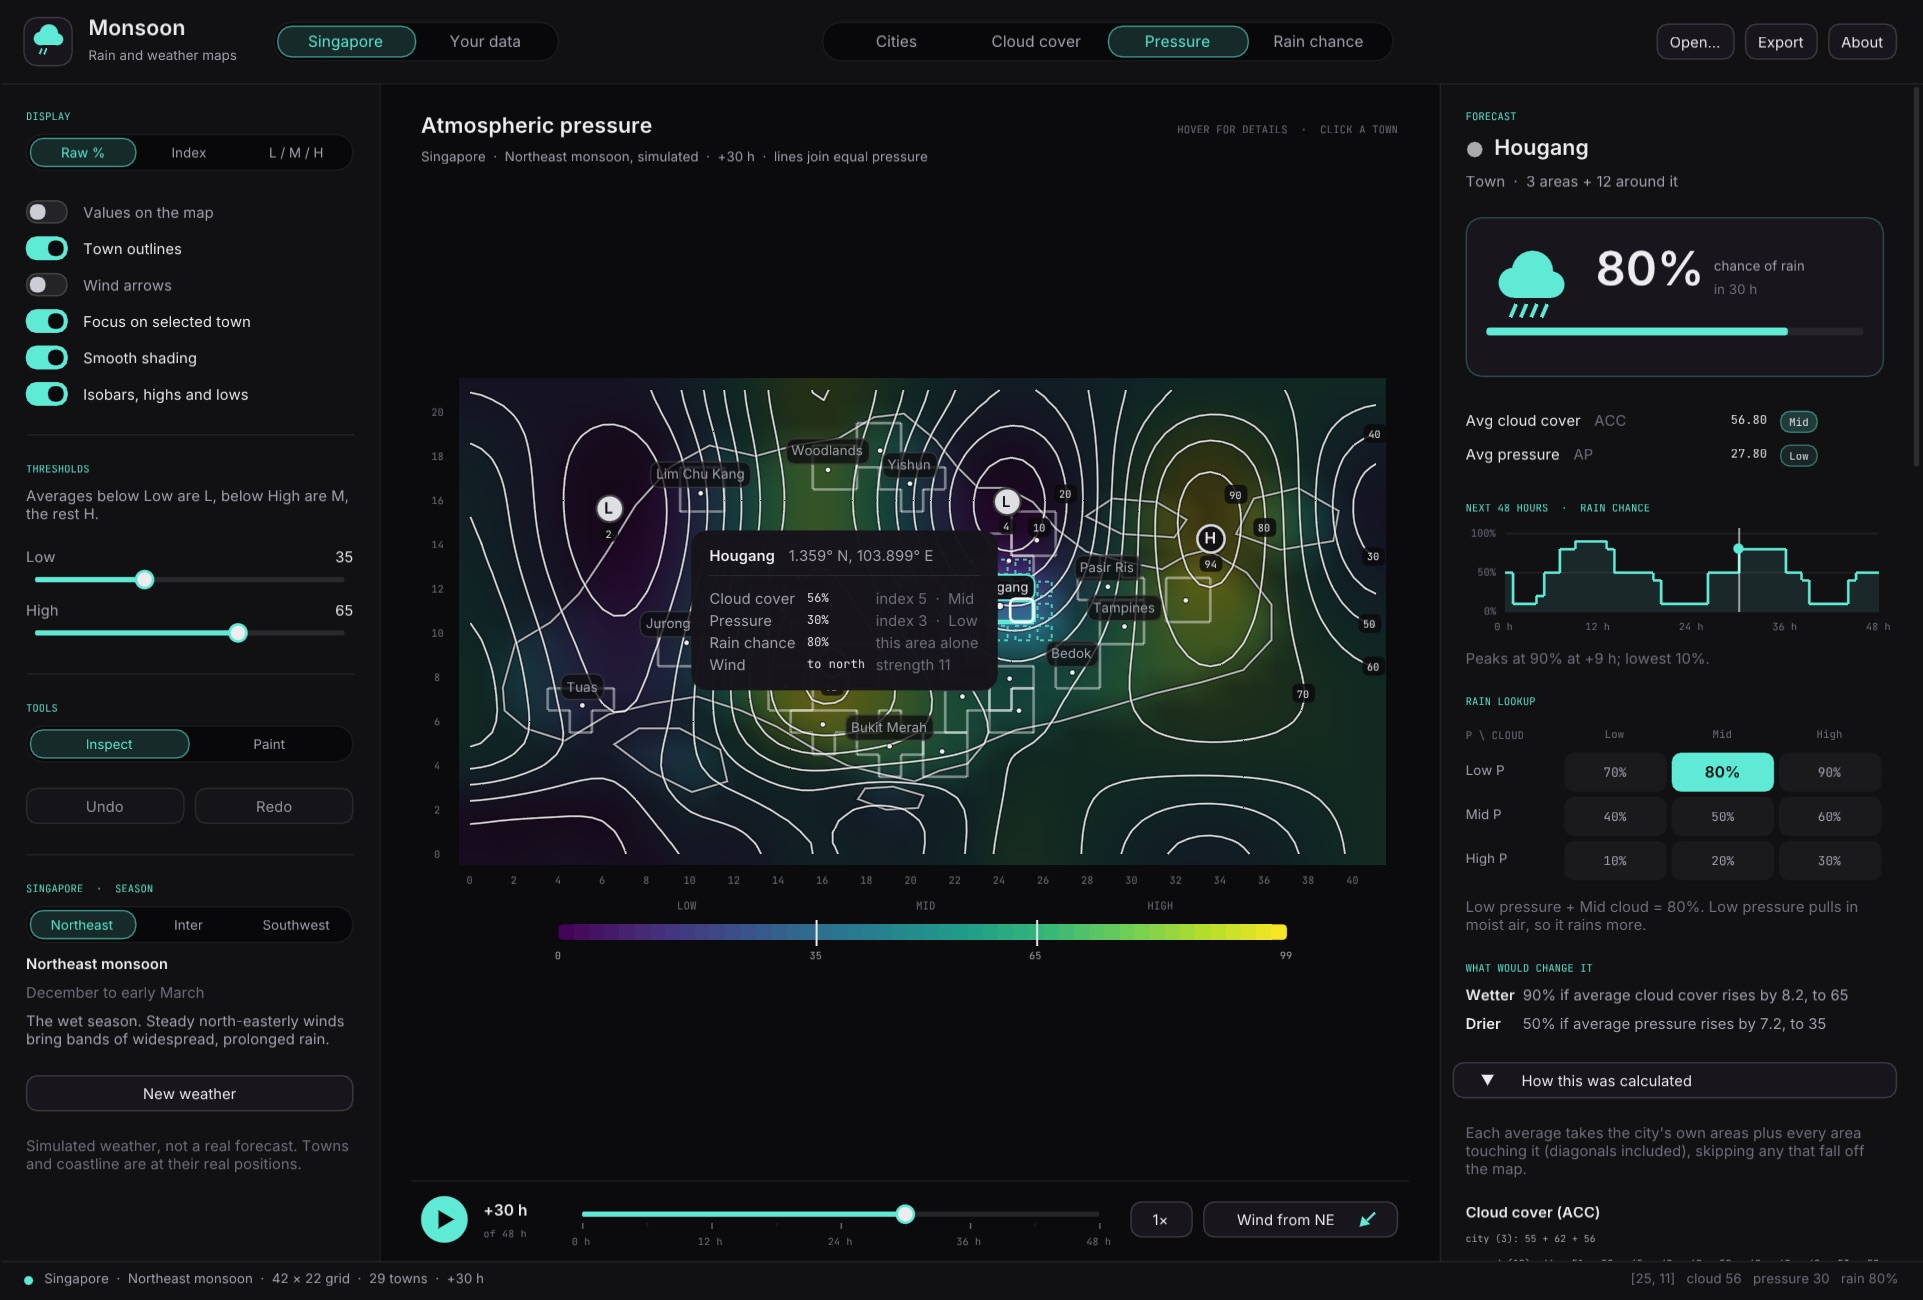
Hover details over the pressure map, with isobars and highs and lows

Hover for details

Every area reports its cloud cover, pressure, rain chance and wind, with its latitude and longitude.

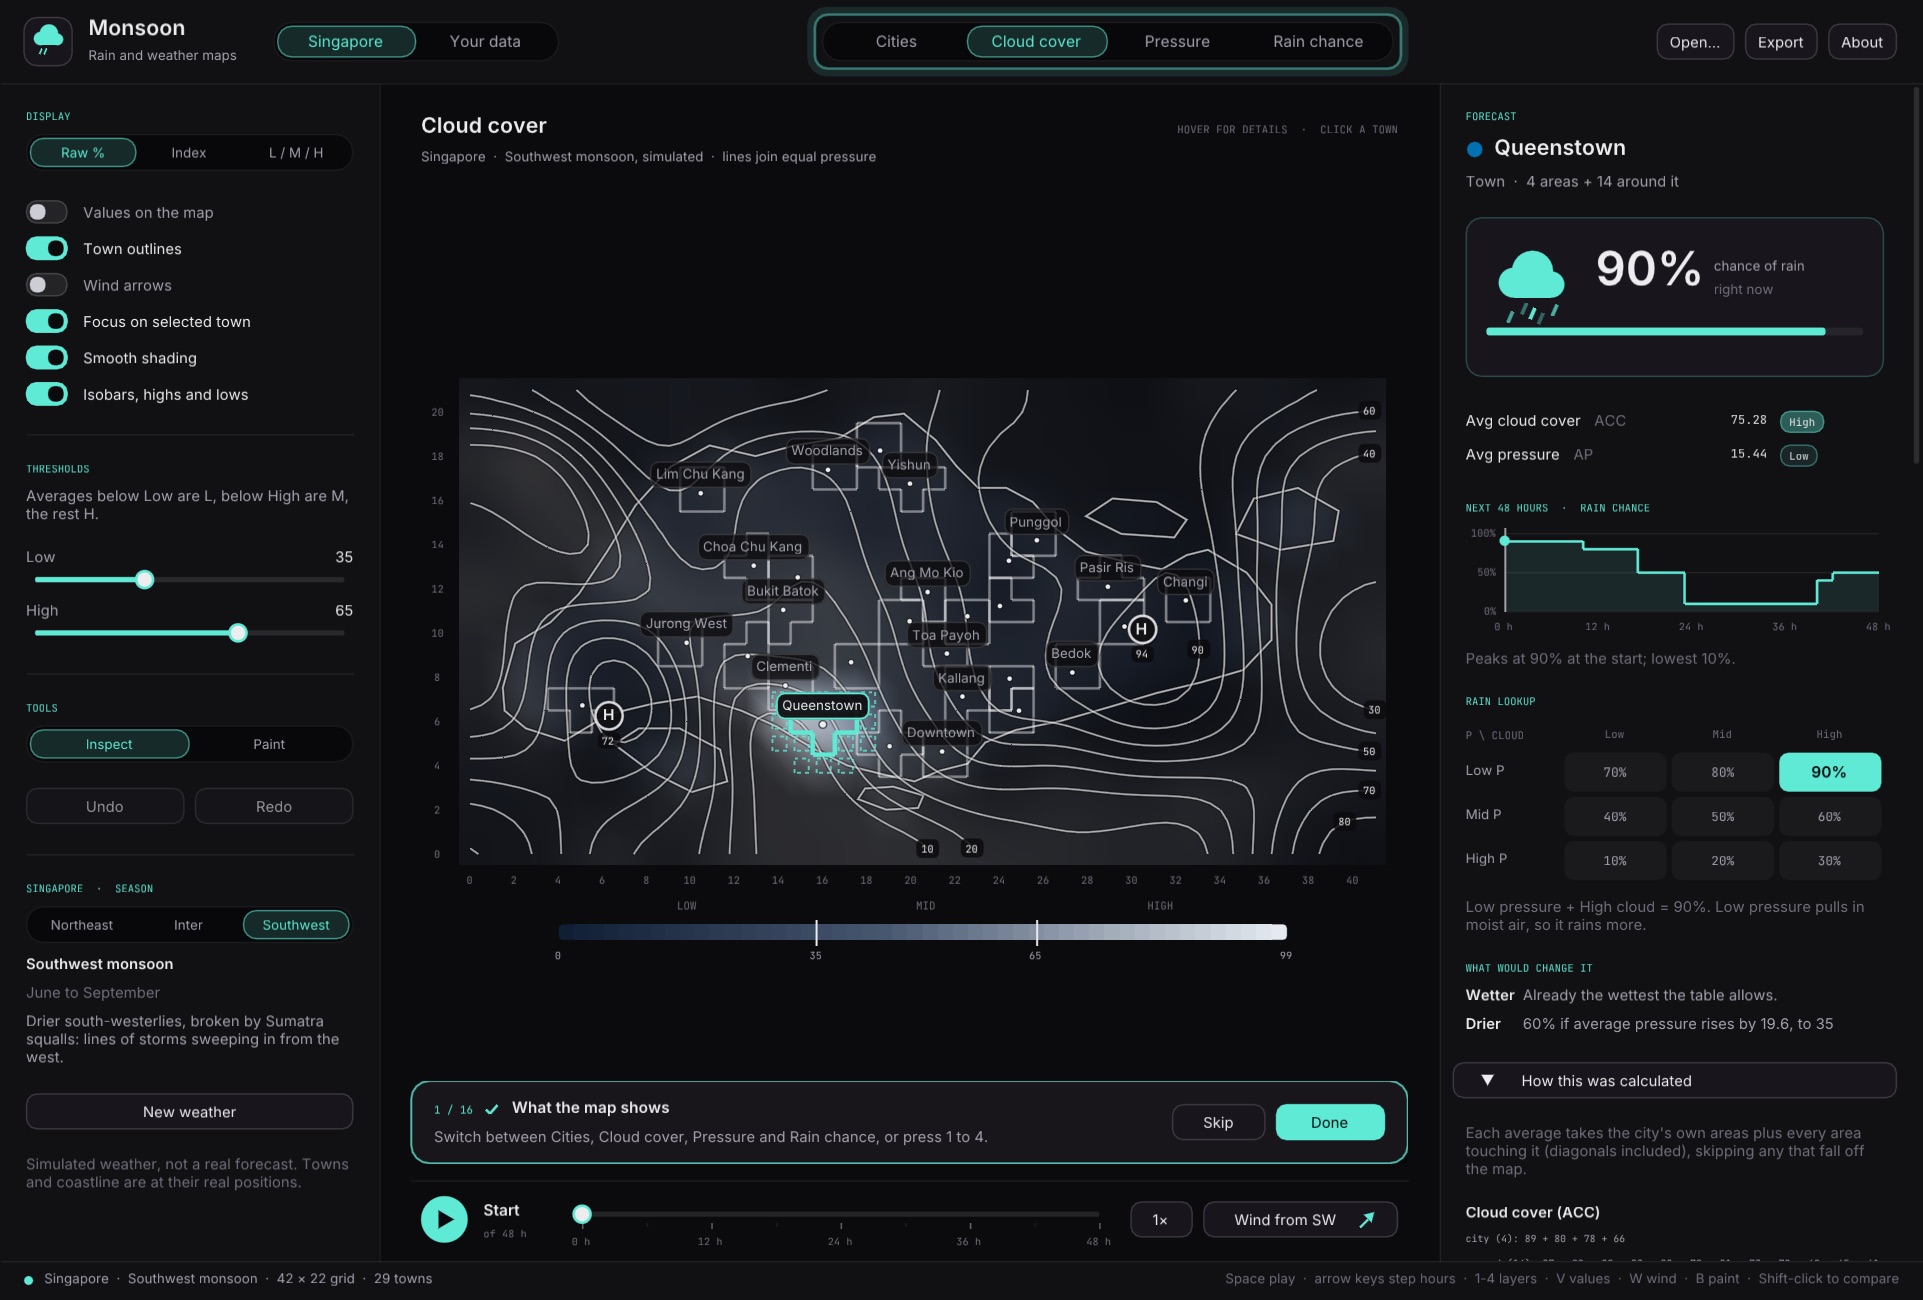
The feature tour's caption bar and highlight ring

Built-in feature tour

A 16-step tour that never blocks the app: try each feature yourself, then press Done.

03 / Engineering

How it's built

  • Tested against the spec

    481 automated checks, starting with the assignment's own worked examples. They caught a typo in the specification itself.

  • Fuzz-tested

    20,000 corrupted input files run through the parser, simulation and map code with AddressSanitizer and UBSan watching, with no memory errors.

  • Threat-modelled file loading

    I found and fixed a path traversal in my own file format. Datasets can only read files in their own folder, with size limits, and exports are protected against spreadsheet formula injection.

  • Passes static analysis

    The Clang static analyzer, which reads the code for bugs like memory errors, flags nothing, and it builds with no compiler warnings. Downloaded dependencies are pinned by SHA-256.

  • Visual regression tests

    Key screens are rendered without a window and compared pixel by pixel with reference images, so unintended changes fail the build.

  • Fast and accessible

    Under 1 ms per frame on the Singapore map, and idle when nothing moves. Colour-blind-safe palettes, values always shown as text, and Reduce Motion support.